Display graphs in lys
Plotting an 1D data
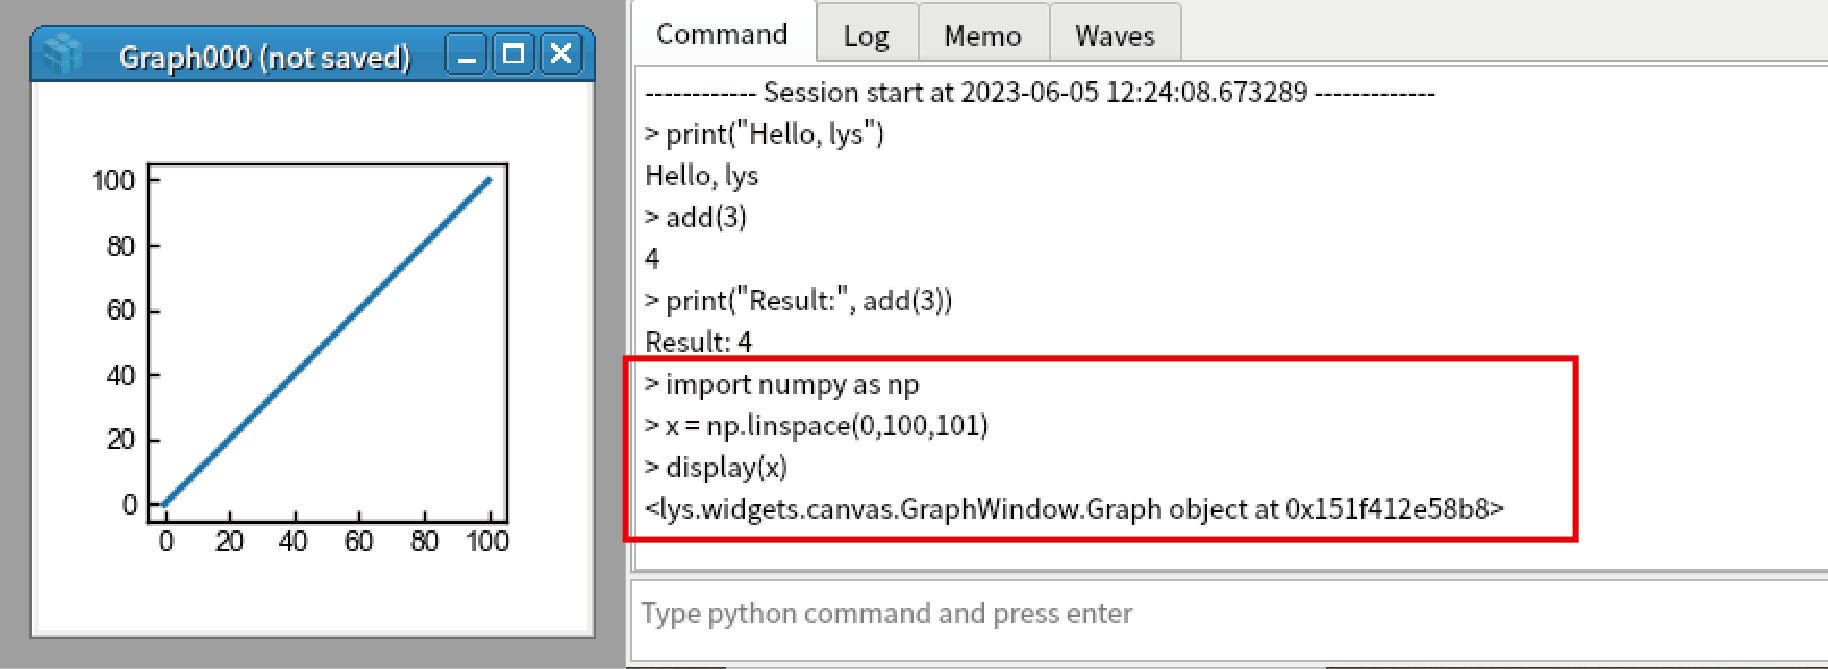
Type command below to prepare data (You can copy and paste the command below into lys command line):
import numpy as np
x = np.linspace(0,100,101)
display is a built-in command in lys to show data in graph. Type command below to display data:
display(x)
You see a line is displayed in graph.
Close the graph by clicking x button at the top right edge of the graph.
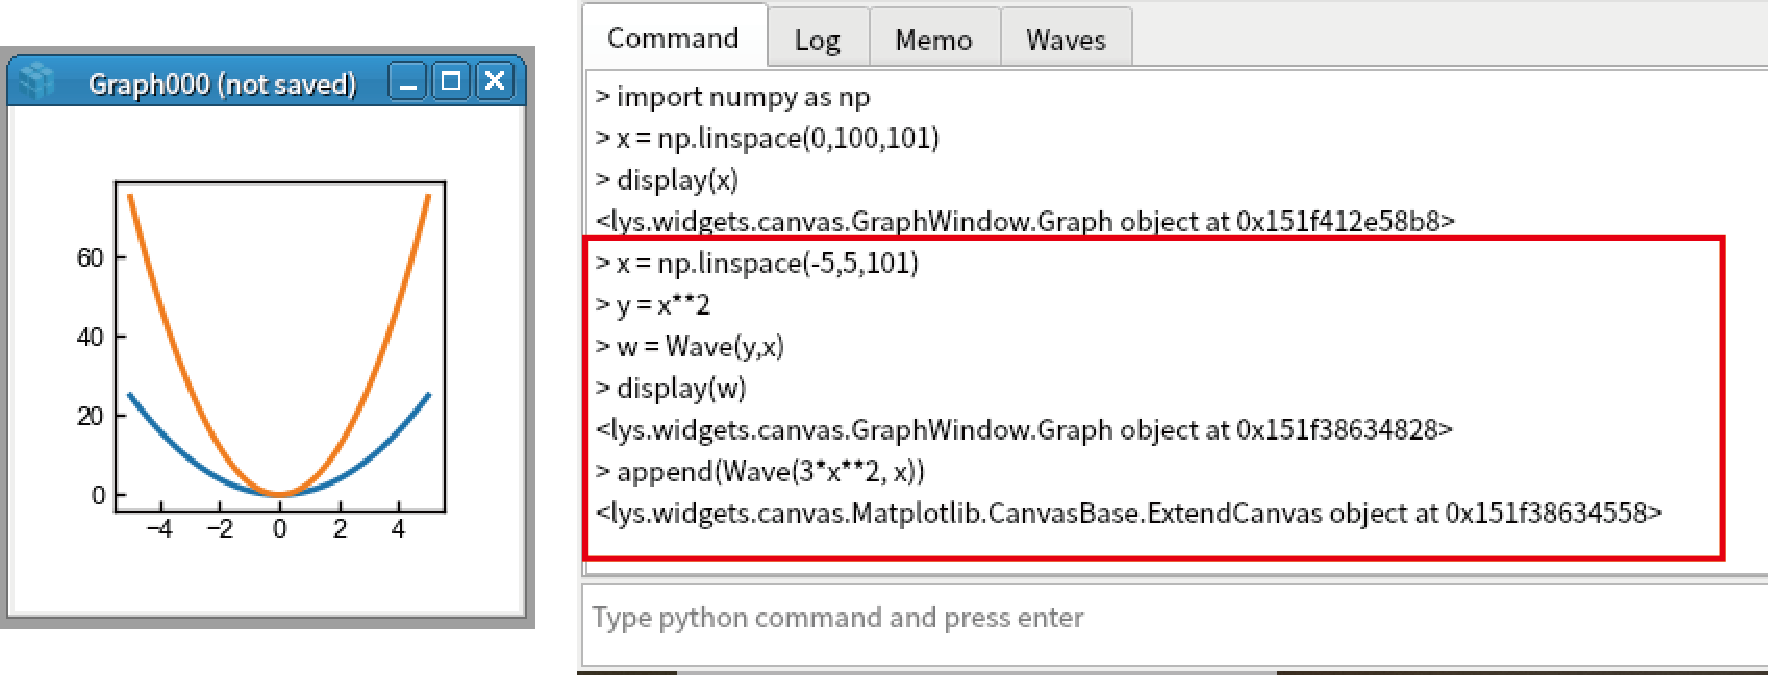
When you want to set the axis, you should use Wave class (
lys.core.Wave):x = np.linspace(-5,5,101) y = x**2 w = Wave(y,x) display(w)
You can append new curve by append method:
append(Wave(3*x**2, x))
Make publication-quality graph by matplotlib
Left click the graph and select “Graph Settings”. Setting window appears in the right sidebar.
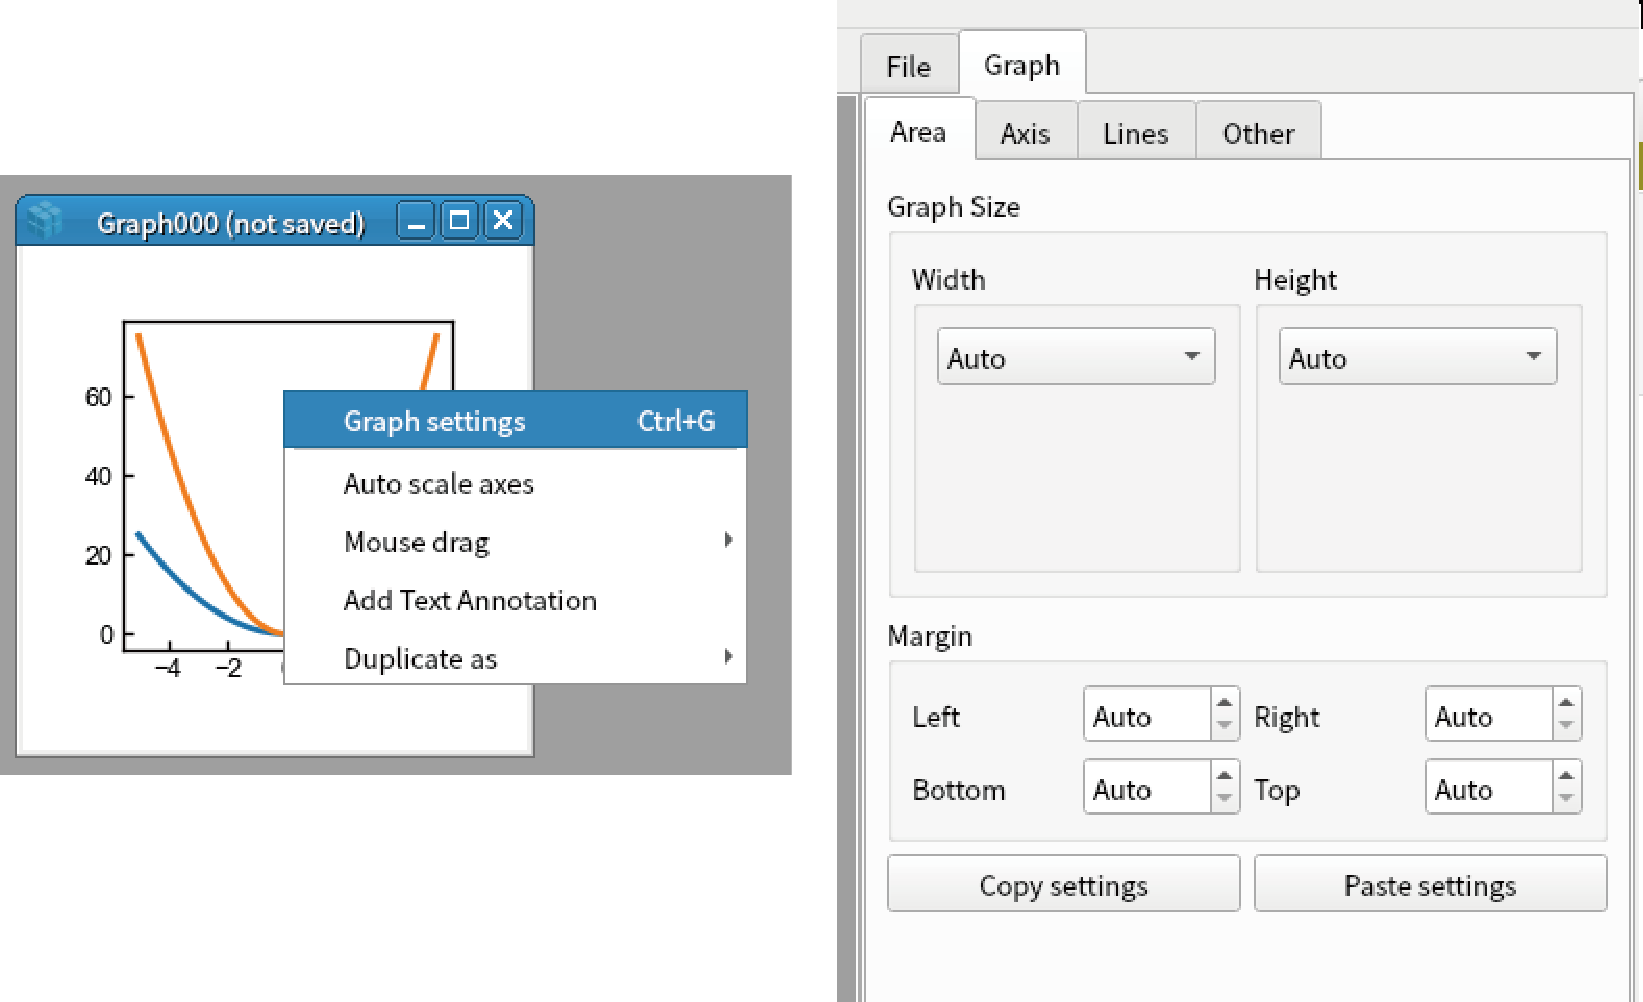
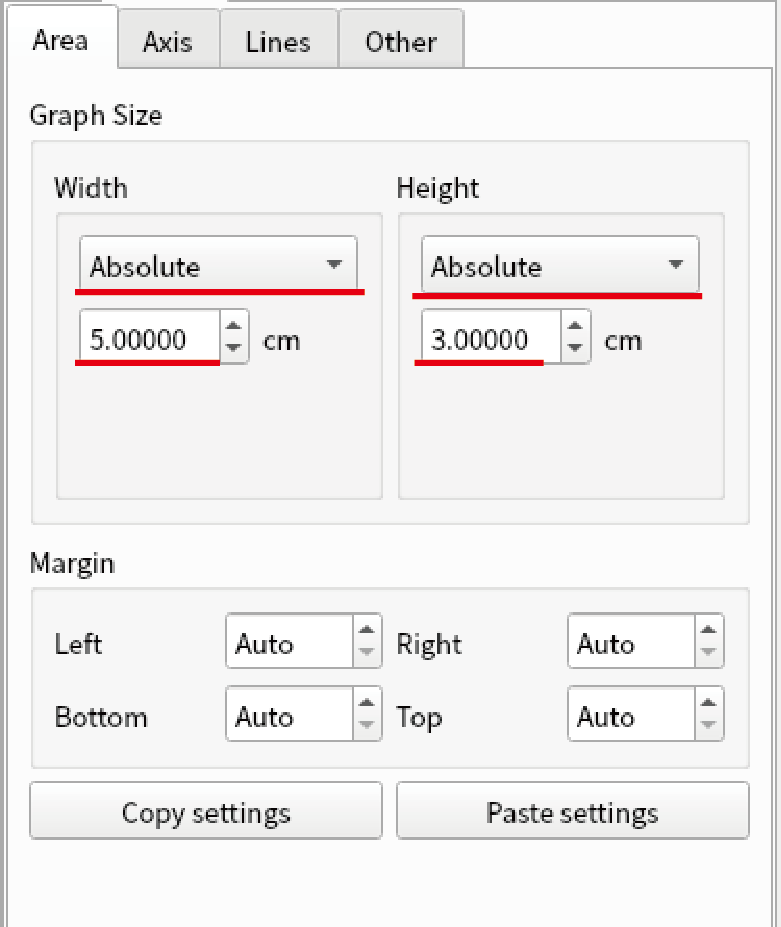
Set the “Width” and “Height” in “Area” tab to “Absolute 5 cm” and “Absolute 3 cm”
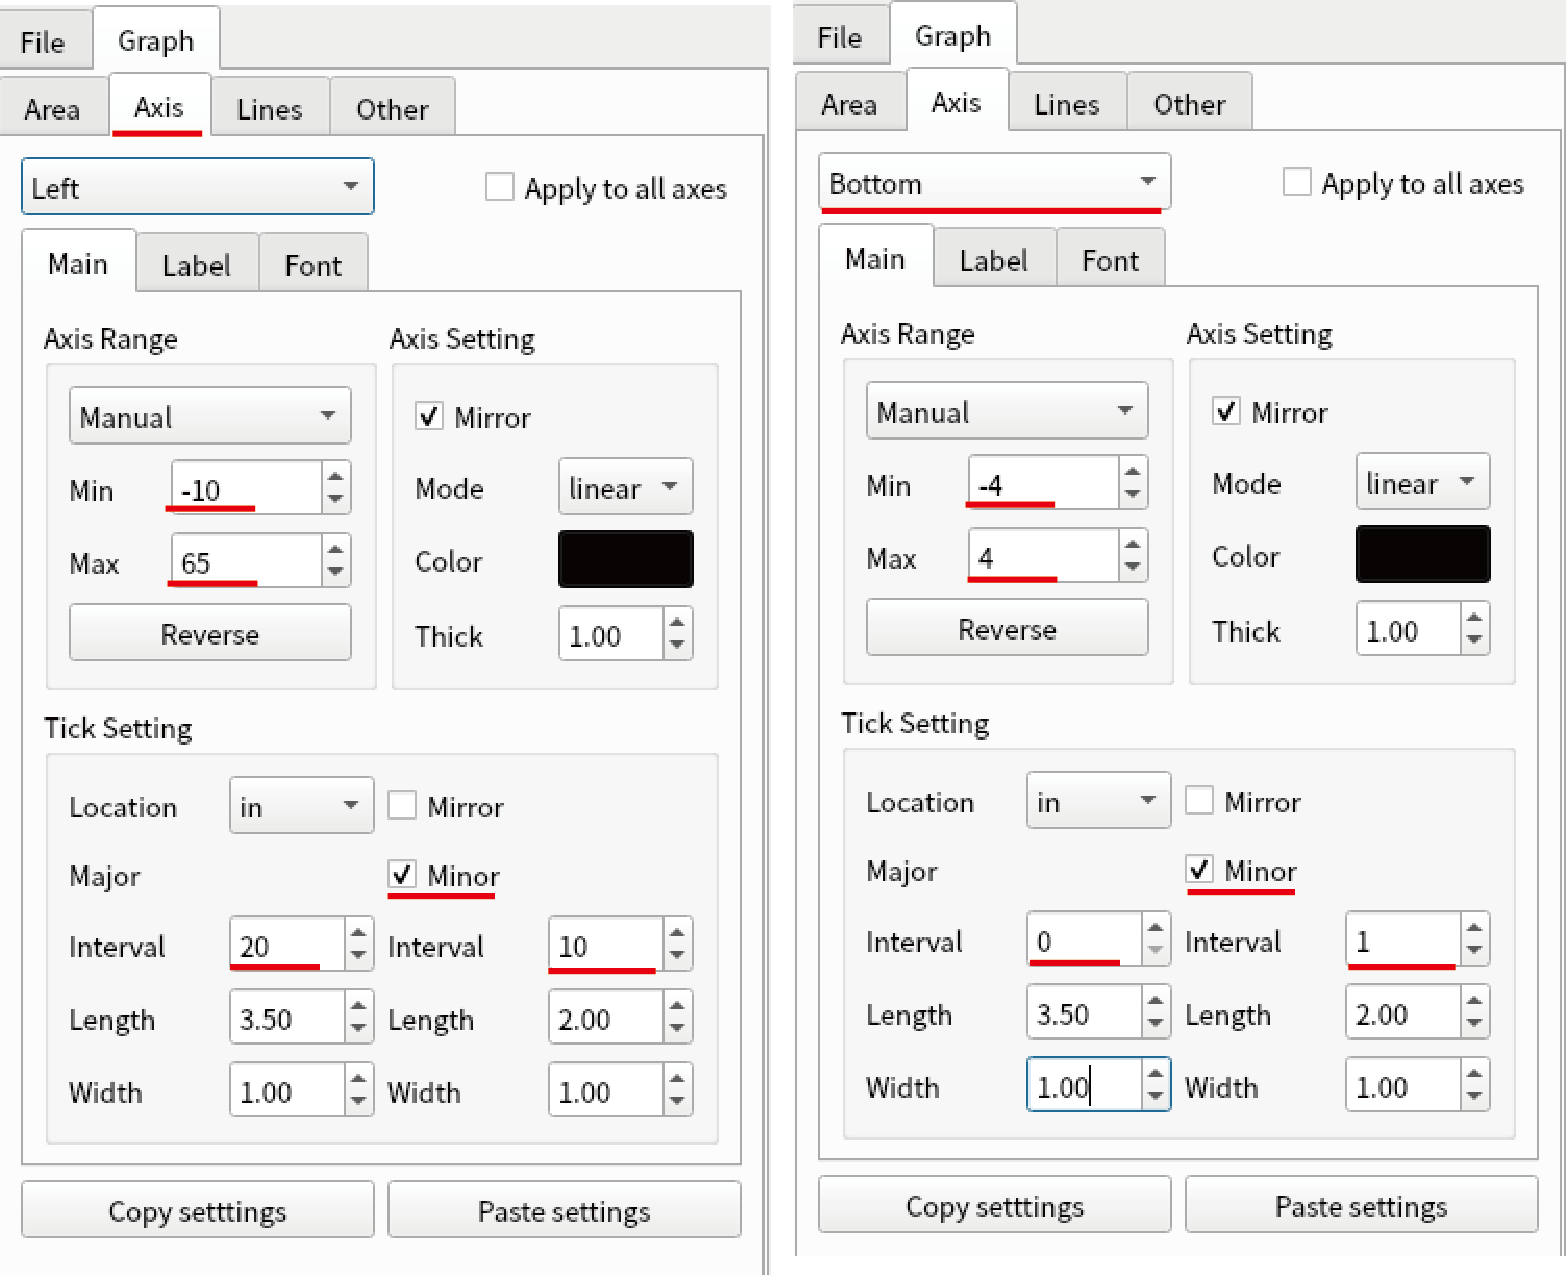
Go to “Axis” tab and then set the parameters below.
Axis Range: -10 to 65
Tick Setting - Interval: 20
“Minor” in Tick Setting: Checked
Set “Interval” below “Minor”: 10
Change the combobox at the top to “Bottom”, and set the paramteres below.
Axis Range: -4 to 4
Tick Setting - Interval: 0 (Auto)
“Minor” in Tick Setting: Checked
Set “Interval” below “Minor”: 1
Change “Main” tab to “Label”. Set the following. You can use tex syntax inside $$.
Axis Label (Left): $y=ax^2$
Position (Left): -0.14”.
Axis Label (Bottom): $x$ (m)
Position (Bottom): -0.14

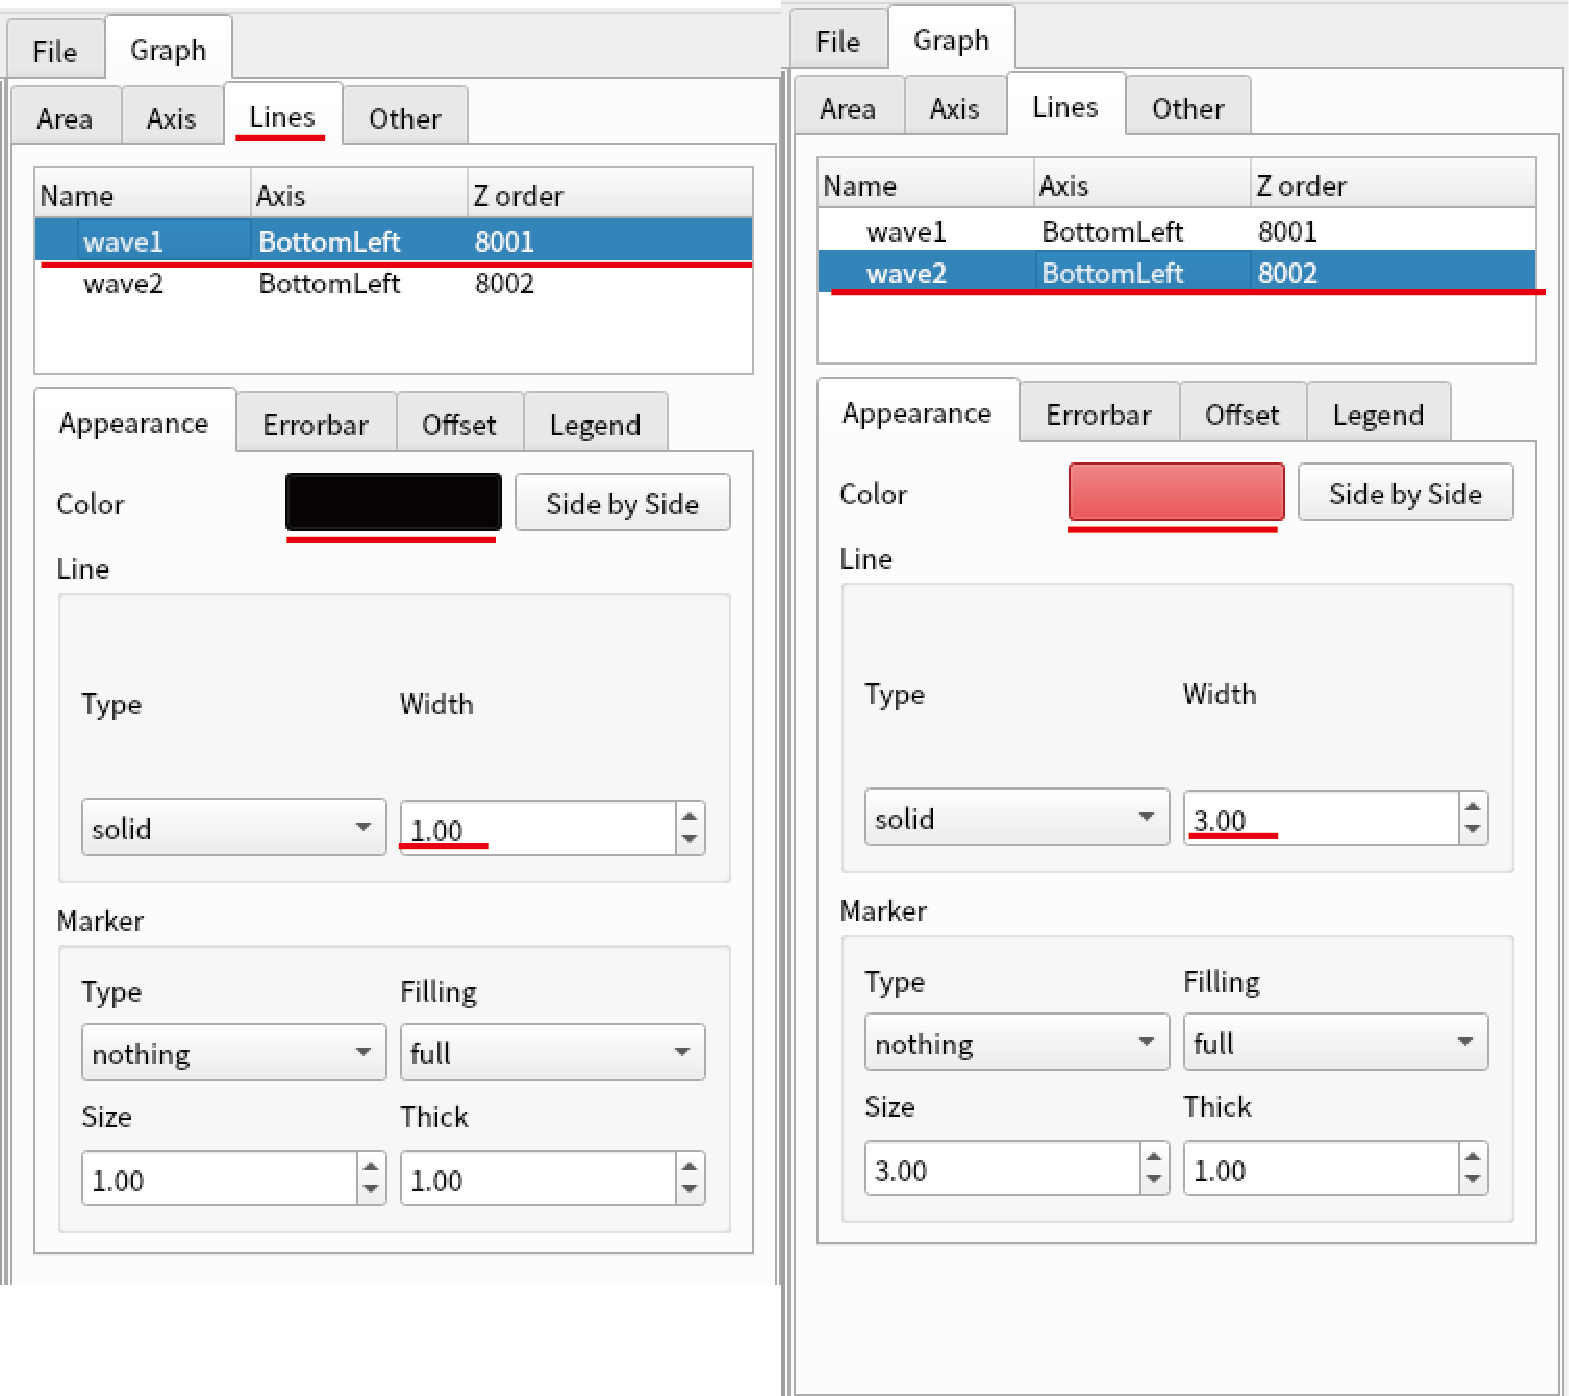
Goto “Lines” tab and then set the parameters below.
Color (wave1): Black
Width of Line (wave1): 1.00
Color (wave2): Red
Width of Line (wave2): 3.00
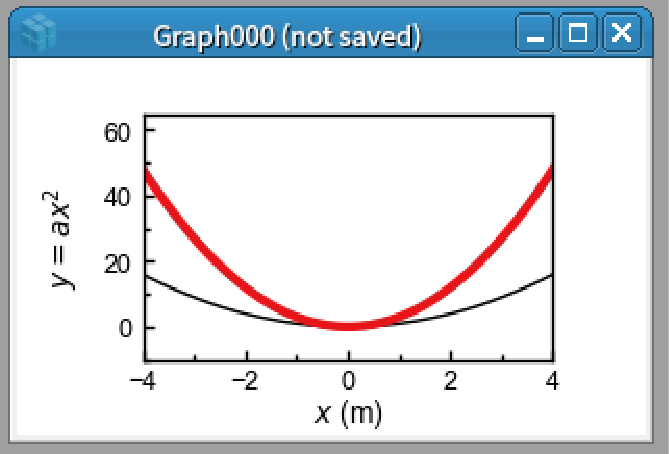
Now you have good publication-quality figure. You can modify most of features in the figure from Setting window.
Save and export
Press Ctrl+S on the graph and save the graph as “curve.grf”.
Close the graph by clicking x button at the right-top edge.
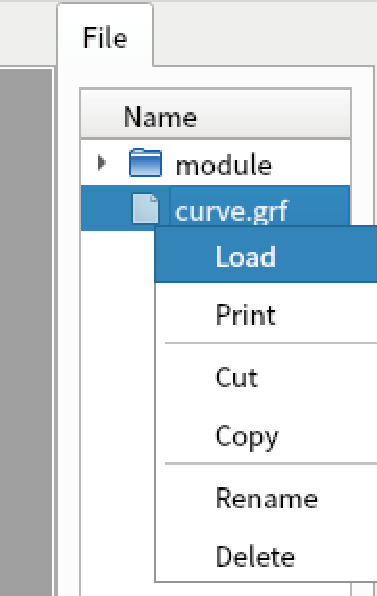
At the “File” tab in the sidebar, you see “curve.grf”. Right click it and select “Load”. You will see the graph is loaded.
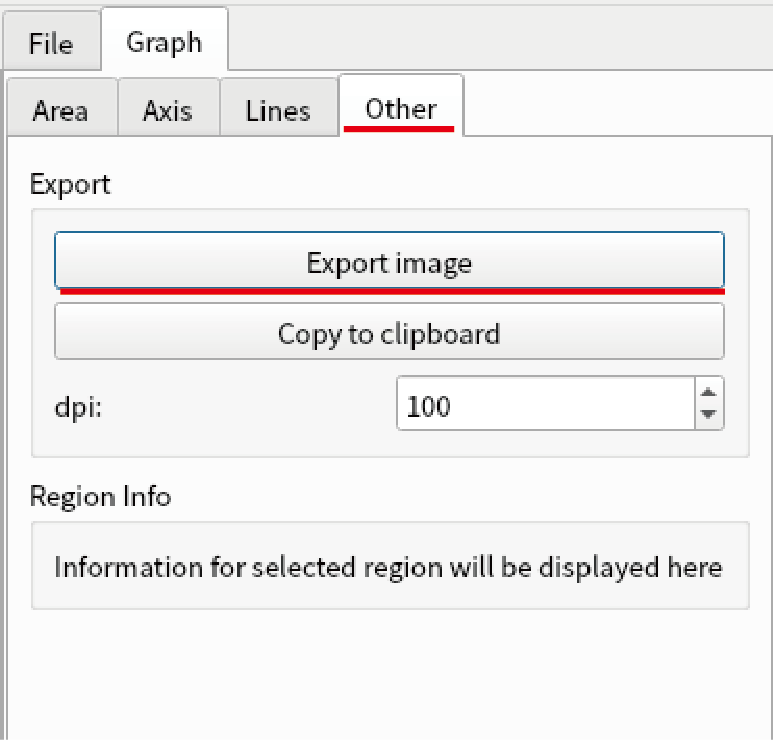
Double click the opened graph and select “Other” in the graph setting. You can export the image as pdf, png, and eps from “Export image” button.
Now you can display, edit, save, and load graph in lys. Go to next step(Interactive GUI analysis system MultiCut). For further learning, see tutorials below.
2D, vector, contour, and RGB plotting (Displaying various data types)