Display cells3d data in scikit-image
This example shows how to open four-dimensional array, which is obtained from scikit-image. After loading and displaying data, we will try to smooth the image.
This example requires latest scikit-image. If you have not installed scikit-image, install it before launching lys:
pip install scikit-image
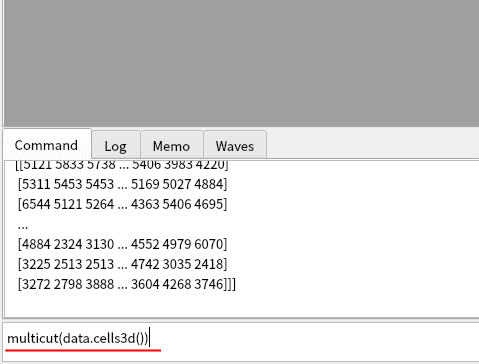
Launch lys and open cells3d data by MultiCut by typing the command below:
from scikit-image import data
multicut(data.cells3d())
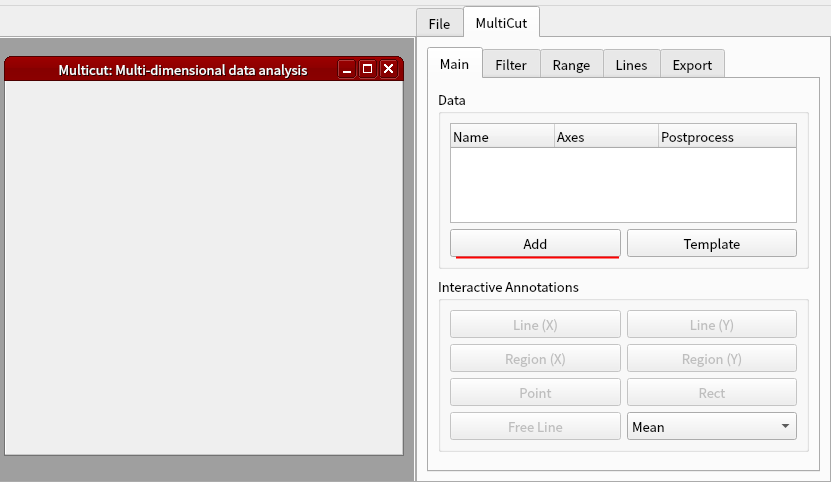
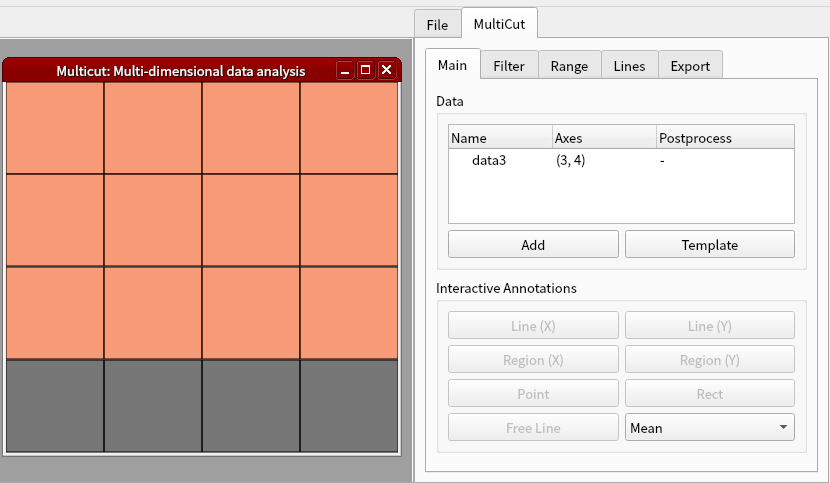
The shape of the cells3d data is (z, c, y, x) = (60, 2, 256, 256). Click Add button in MultiCut tab.
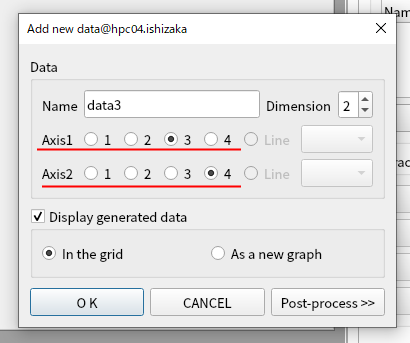
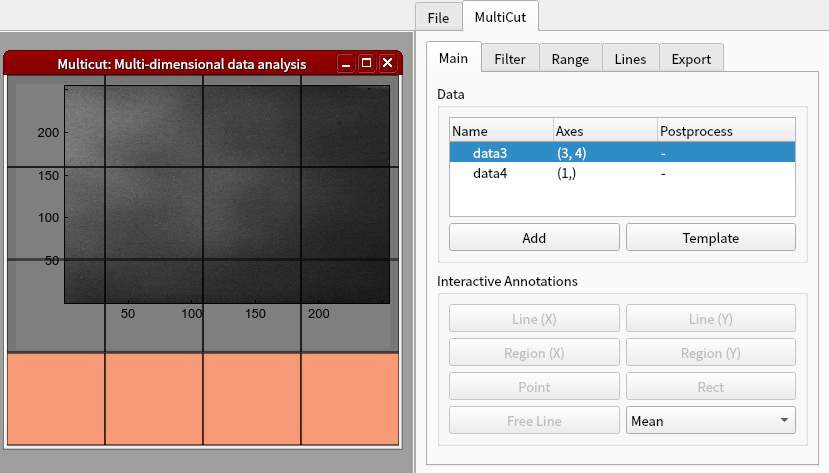
Set (axis1, axis2) = (3, 4) and click OK.
Select where to display the image.
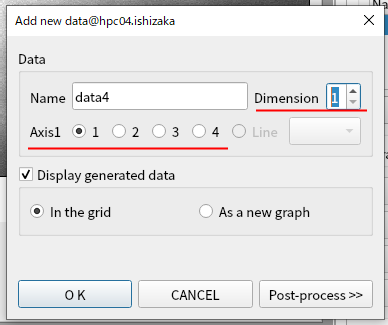
Click Add button in MultiCut tab again. Set the dimension to 1 and axis1 to 1. Click OK.
Select where to display the curve.
Click the bottom graph and click Line button.
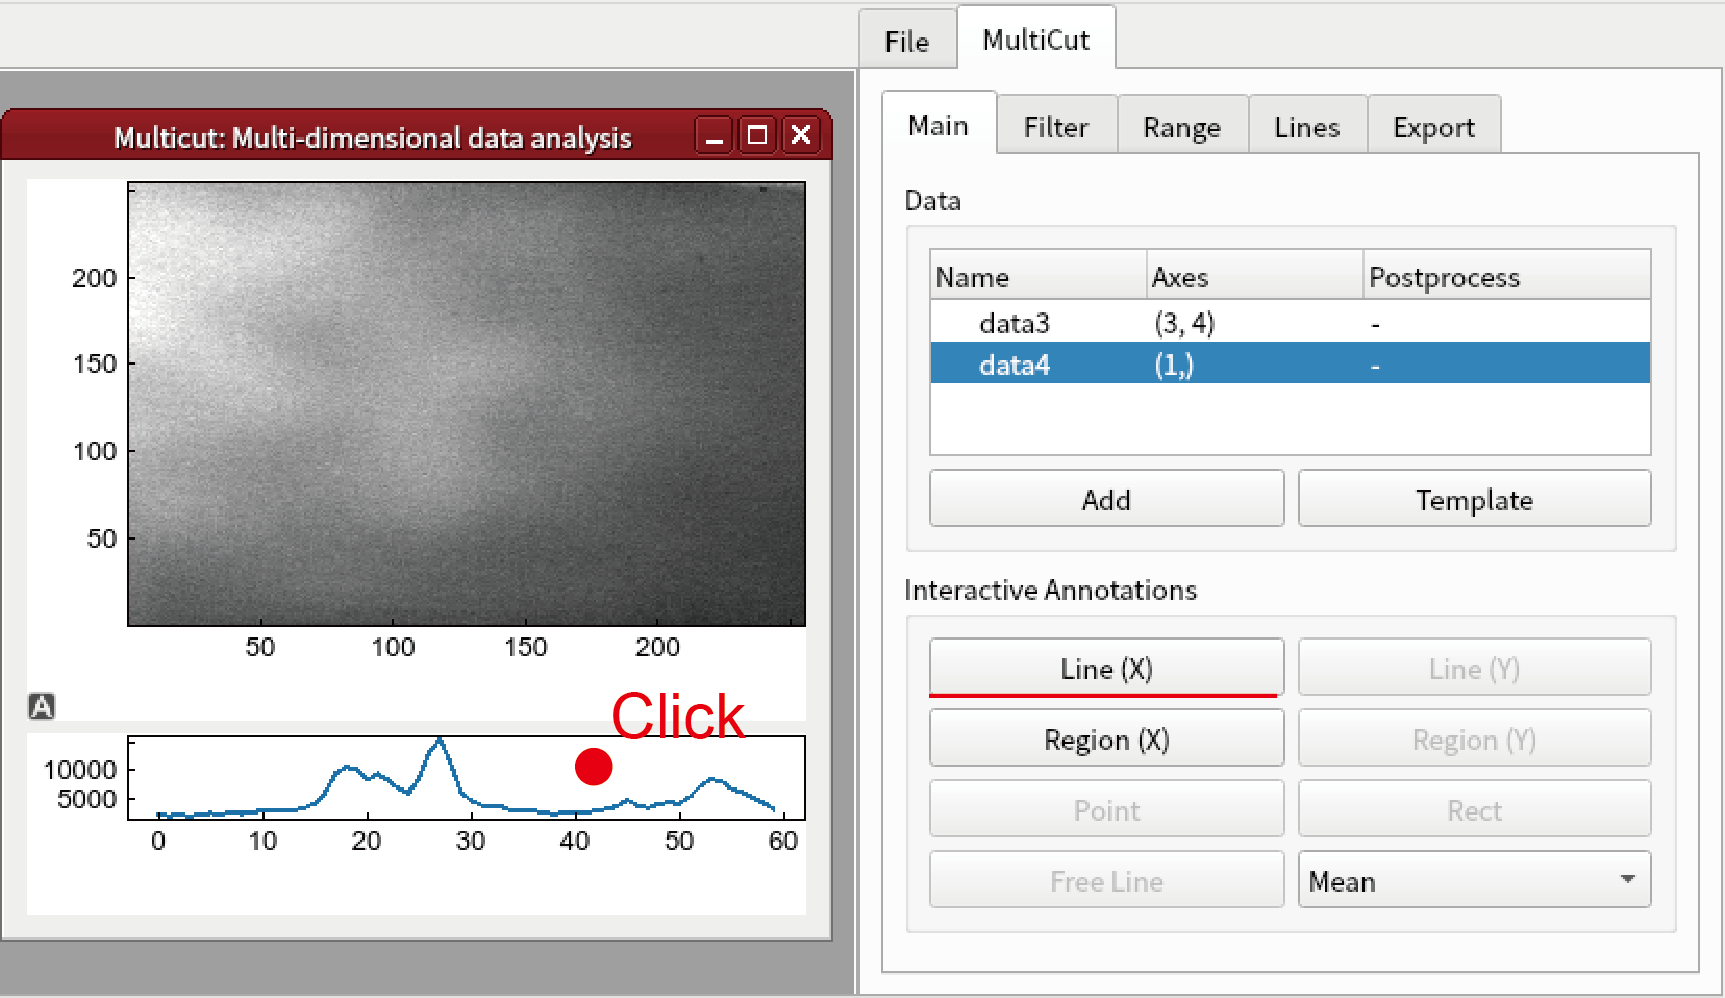
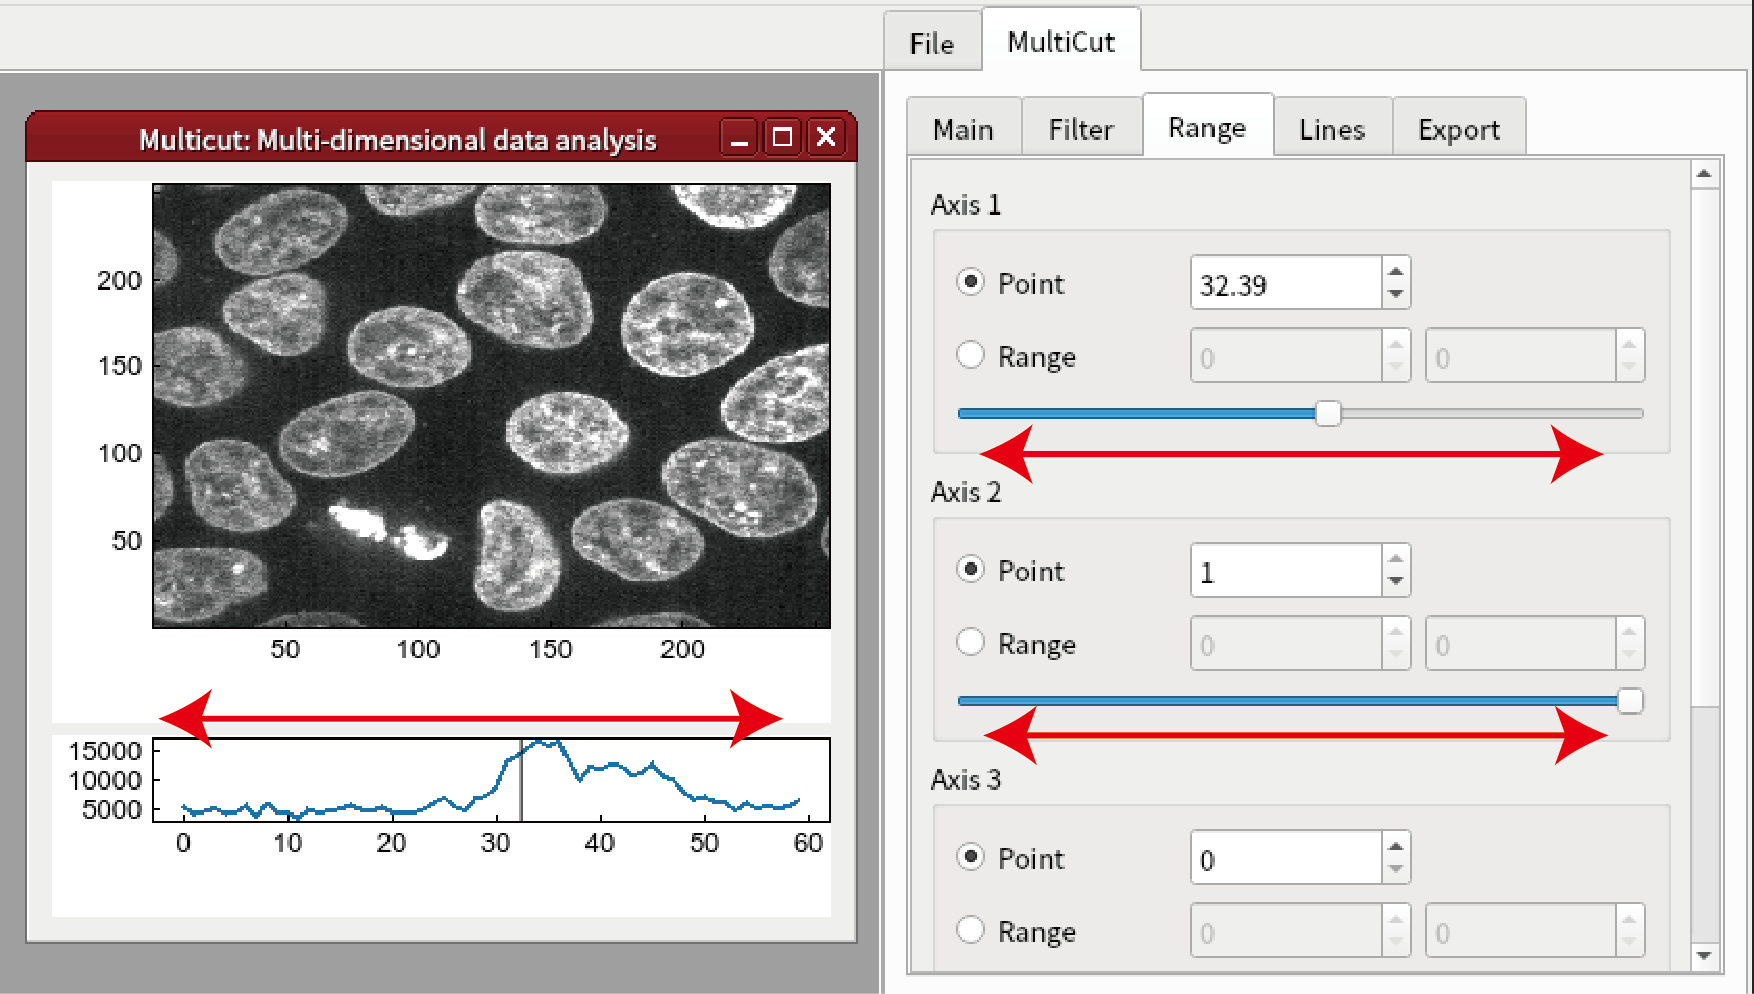
You can change z by changing the line annotation. It is also possible to change z and c by changing slidebar in Range tab. It is noted that only 0 or 1 can be set for the axis 2 (c axis).
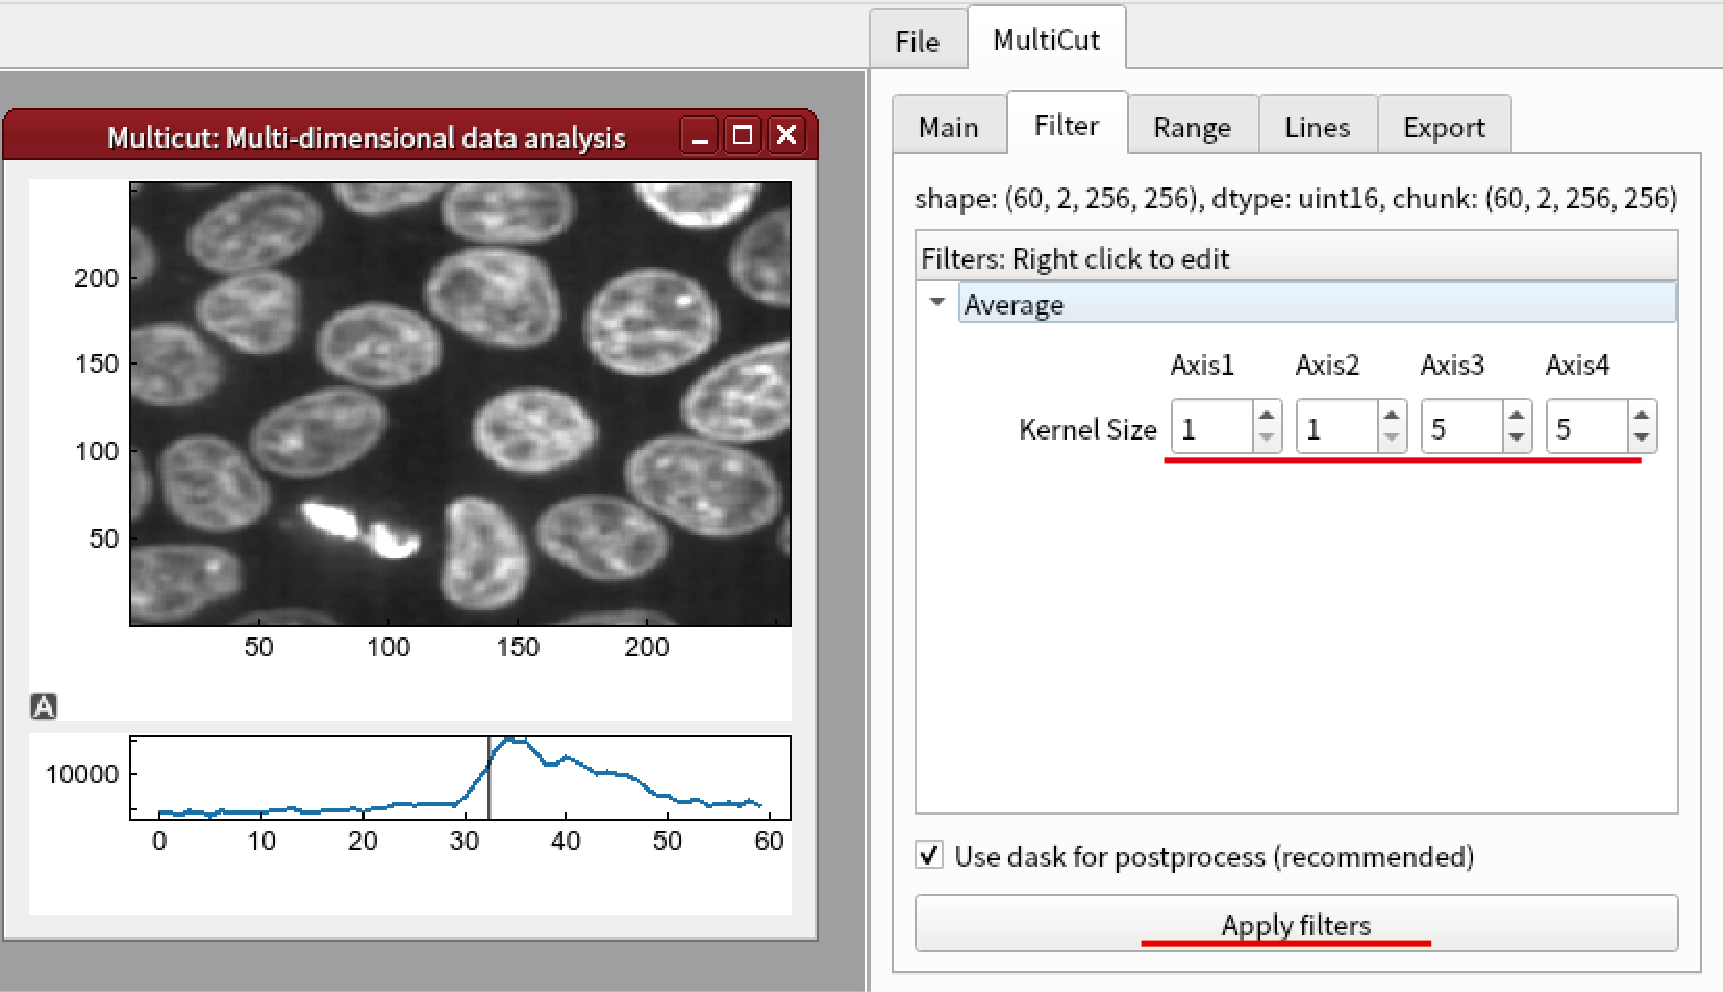
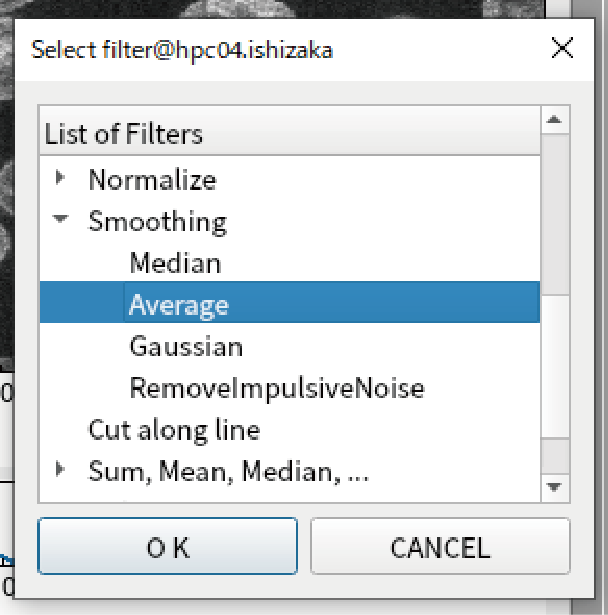
Go to Filter tab and select Add Filter from the right-click menu.

Select Smoothing -> Average.
Set the kernel size to be (1,1,5,5) and click Apply filters button. The image will be smoothed.